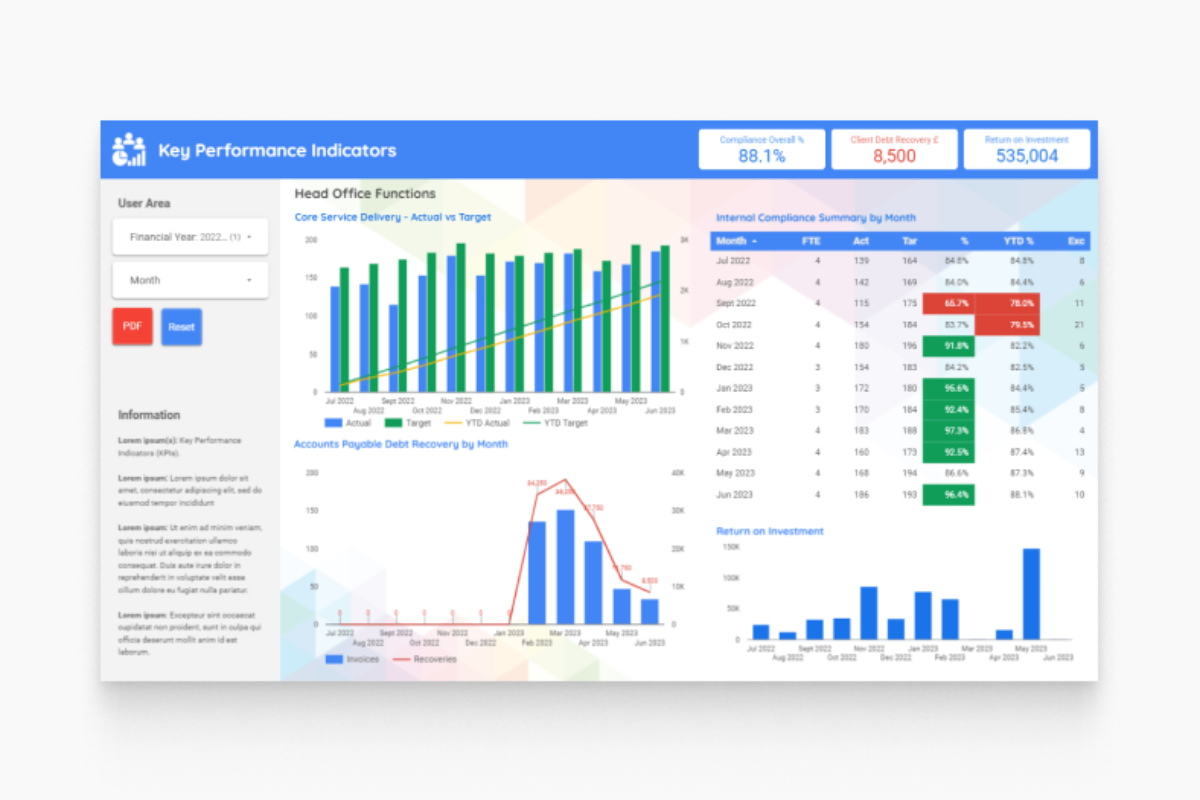
Visualising important data is central to every business, so what do you need to consider when deciding upon the use of a spreadsheet application or a web-based reporting dashboard?
Here are eight tips:
- Large and complex spreadsheets are easily broken and are often not the best way to store, crunch and provide value added benefits from large sets of data – it’s probably only the original creator of these bigger spreadsheets who knows how to maintain them.
- The security around sharing spreadsheets is less protective than sharing data through an online dashboard – which has the added feature that the data cannot be corrupted by the user.
- Spreadsheet skills are widely available and usable in many other roles within the business but that doesn’t mean those people have the right blend of talent to create effective dashboards.
- Good web-based dashboards are developed by those with good design, web reporting and digital technology skills (including database management) which not only give what’s needed but does so in a way that’s easy on the eye and intuitive to use.
- There’s more than one web-based reporting tool to choose from (buy or subscribe) – so which is best for what you need? We can help to research the options, or if guidance is needed.
- There is a cost of failure as there is a steep learning curve in developing good effective online dashboards. Outsourcing this could result in a better investment for your business.
- Data sources are key. Consider whether internal data will suffice or if you need to acquire externally sourced data for comparison purposes to make your dashboard truly effective.
- Understanding your target audience is extremely important. Not just for the type and depth of data shown but whether the data is presented as a multiple page, data heavy dashboard or a single page ‘story’ that encapsulates the key messages.
The key advantages of developing web-based dashboards is that they allow decision makers to quickly and accurately digest high volumes of data and so enable better decisions to be made faster.
Variances, against what is expected, will be identified immediately and the key performance indicators can be at the very forefront of what you see first.
Through the use of real time visualisations: charts, graphs and mappings – a dashboard helps to identify patterns, correlations, and trends in complex data sets that would be difficult and time-consuming to identify manually or via a spreadsheet application.
They are able to provide a snapshot (often updated in real time) of key performance indicators, at a glance. This allows decision-makers to track progress and identify anomalies that need attention in an interactive, “de-skilled” setting – dashboards are user-friendly and intuitive, meaning users don’t have to be experts in data analysis to use them.
Facilities management in general lends itself to adopting dashboarding technology. The most common use of dashboarding within FM settings are listed here with some examples:
- Analytical – such as those monitoring the effectiveness of purchasing through the comparison of product level pricing with other similar organisations which improve the Procurement Manager’s insight and readiness for negotiations with their supply chain.
- Operational– including life cycle management, maintenance information, value and locations; coupled with sensor technology too that provides real-time information and alerts to the dashboards.
- Strategic – providing decisions makers with information relating to key areas such as footfall, uptake in retail areas and foodhalls, including aspects such as Free School Meals in schools along with consumer insight results compared with similar organisations, including competitors.
Dashboards are bespoke and may be built, from scratch, to address any data reporting requirement.
The main reasons dashboards are adopted by organisations are as follows:
Automate repetitive tasks and reduce human error
Increasing workloads and multiple responsibilities means mundane repetitive tasks can be eradicated. With their easy-to-use interface and real-time data representation, dashboards deliver a clear and concise summary of critical data.
Report building
Reduce the tedious task of building reports and streamline workloads whilst still producing effective results. Utilising templates, visually engaging reports can be created in a few minutes – delivering data professionally to both internal and external stakeholders and also releasing time to do more meaningful work.
Analyse data in real-time
Displaying data in real-time means informed decisions can be made faster.
With an at-a-glance view of data, trends and patterns any areas of concern are seen with ease. Additionally, with the ability to drill down and interpret data, a more detailed analysis of specific issues can be investigated.
One version of the truth
Collaboration across, often multi-disciplined, teams contributing to overall success can be difficult to manage effectively. Dashboards can provide an overall view of accomplishments (or failures) to individuals and teams and help identify areas for remedial action or advocate new ways of working.
Set actionable objectives
Dashboards can provide regular, clear snapshots of performance so long as the objectives set are measurable and specific.
Litmus are leaders in FM related dashboard development and maintenance. Please let us know if we can help develop your dashboarding strategy here.

