Dashboards & reporting samples

Expertise Passion Innovation logo

Simplifying complexity

When reporting, our goal is to simplify complexity. We construct our reports so that users can access the information needed in just a few seconds – no matter how many outlets, profit or cost centres there are within an operation.

Each dashboard or report is tailor made to meet the specific requirement of the organisation and features the ability to export data sets into Microsoft Excel®, Adobe PDF® and other useful formats.

We have invested in the technology to put everything at your fingertips because that’s what our clients asked for.

We have provided links to a range of typical reports. Please access them by clicking or tapping on the screens below.  The dashboard will open in a new tab.

Learn how to navigate a Litmus dashboard here.

Example Consumer Insight Report

Where customer satisfaction is concerned the numbers can be complex.

Success is driven by being geared up to ‘do best what matters most’ to your consumers. This means not only determining how satisfied they are with elements of a service provided, but also benchmarking this outcome against the relative importance placed upon those areas.

When we undertake a consumer satisfaction analysis we report the findings via an interactive dashboard which gets to work calculating average importance and satisfaction scores for the whole sample as well as sub-analysis by any combination of demographic criteria.

In the end, it’s obvious what matters most to your consumers and what needs to be done to improve the satisfaction rating.

Litmus Results Analysis
Litmus Partnership Demo Monitoring

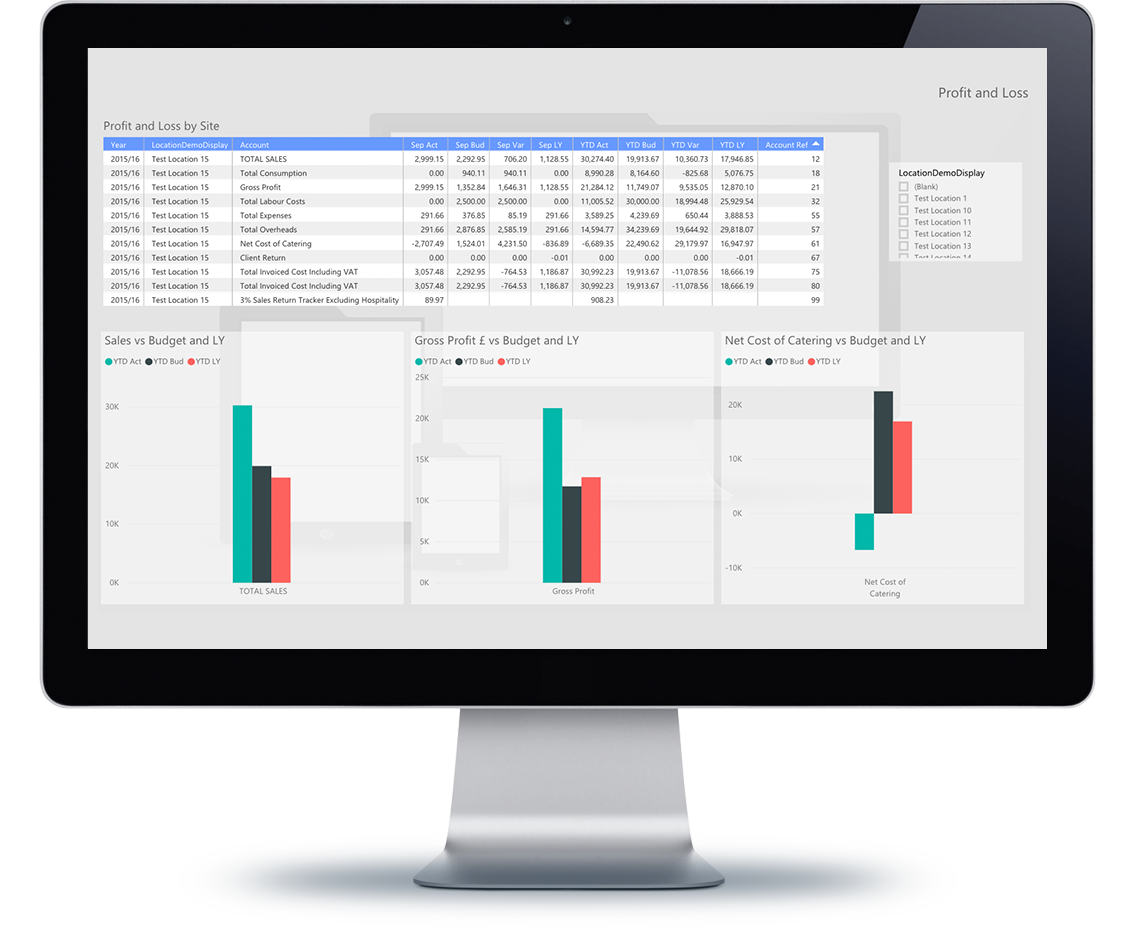
Example Account Monitoring Report

We’re highly skilled in the delivery of reporting solutions that remove the need for our clients to get caught up in the detail and complexities of all the data we collect on their behalf to determine if performance levels have been achieved or not.

Our Monitoring Reports show if you’ve been correctly charged for the services that you have been provided with.

About our reports

UniqueReports are built to reflect specific requirements. See what you need to see and know what you need to know.
DrilldownOur reporting is interactive. Click on an area or a number when you want more detail or need to focus on a particular cost or service.
AccessibleWe have made the data relating to our reports accessible. If you need to construct a particular report then you can do so locally.
ProtectedThe data we hold is protected and backed up. Users cannot, intentionally or otherwise, corrupt the original data.

Working with Litmus

“Litmus have great vision as to the art of the possible with technology and are world class when it comes to interpreting data and making it easy for their clients to see and understand what it is they need to know”

Chris Schroeder MD BlueRunner Solutions